Plotting interactions
The data are home heating data from two houses with heating data from the second house with and without an energy efficient fireplace. The first house (Conventional) is a typical house with no special energy conservation measures. The second (Efficient) was designed to be an energy efficient house. The data for the Efficient house are for two different years, one with and one without an energy efficient fireplace.
The unit of heating is the therm, a standard unit of heating, equivalent to 100,000 BTU and roughly equivalent to the heating provided by 100 cubic feet of gas. The amount of heat loss of a house (and thus the subsequent heat demand to keep it at a steady temperature) is a direct function of how cold it is outside. The standard unit of temperature for heating (in the US) is the "degree day" which is the sum across days of the difference of the average temperature and 65 degrees (F).
The slope of the regression of therms on degree days is a measure of the quality of insulation of the house. The flatter the slope, the better insulated the house and the less energy it requires for heating. It also reflects other sources (e.g. a fireplace) of heating.
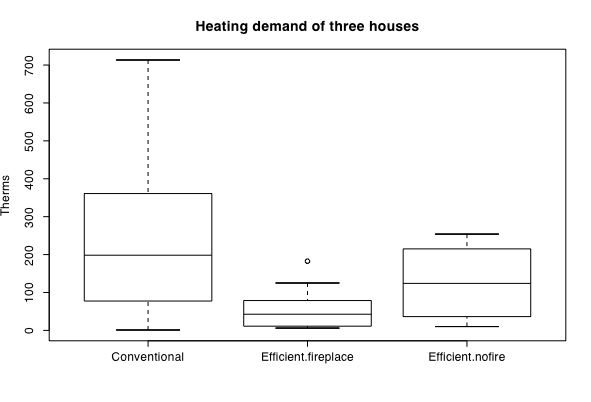
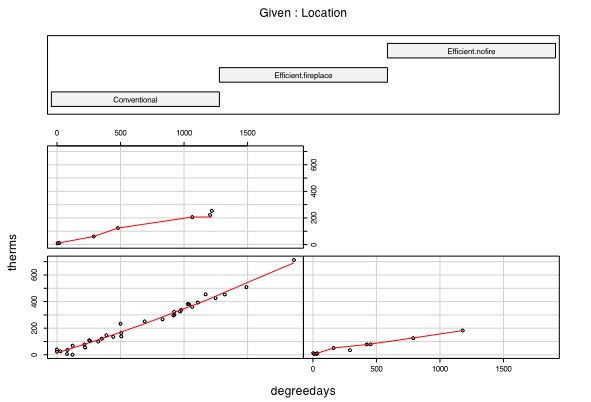
Several different graphical techniques are demonstrated. These will be boxplots for each group, a coplot showing the therms by temperature plots for each house separately, and then a plot with overlaid regression lines.
#demonstration of plotting multiple regression lines
#the data are home heating data from three houses.  One, an energy efficient house, the other, a more conventional house
#therms (a standard unit of heating, equivalent to 100,000 BTU and roughly equivalent to the heating provided by 100 cubic feet of gas)
#degree days are a unit of temperature and are the sum across days of the number of degrees below 65F.

filename="http://personality-project.org/r/datasets/heating.txt"   #where are the data
heating=read.table(filename,header=TRUE)                         #get the data

attach(heating)                           #allows for convenient access to variables by names

boxplot(therms~Location, main="Heating demand of three houses",ylab="Therms")                #show the range, quartiles, and median for all locations
coplot(therms~degreedays|Location,panel=panel.smooth)    #plots therms * degreedays separately for different values of Location
Plot the regressions lines on top of each other to visualize the interaction.
model=lm(therms~degreedays*Location)    #test the main effects of degrees and the interaction between locations
print(model)                            #show the coefficients
summary(model)                          #show the probability estimates for the coefficients

by(heating,Location,function(x) summary(lm(therms~degreedays,data=x))) #give the summary stats for the regression by location

 par(mfrow=c(1,1))
symb=c(19,25,3,23)                              #choose some nice plotting symbols
colors=c("black","red","green","blue")          #choose some nice colors
plot(degreedays,therms,pch=symb[Location],col=colors[Location],bg=colors[Location],cex=1.0,main="Heating demands (therms) by house and Degree Days")               #show  the data points
by(heating,Location,function(x) abline(lm(therms~degreedays,data=x)))  #show the best fitting regression for each group
text(1500,190,"Energy efficient with fireplace")
text(1500,350,"Energy efficient no fireplace")
text(1500,460,"Conventional")
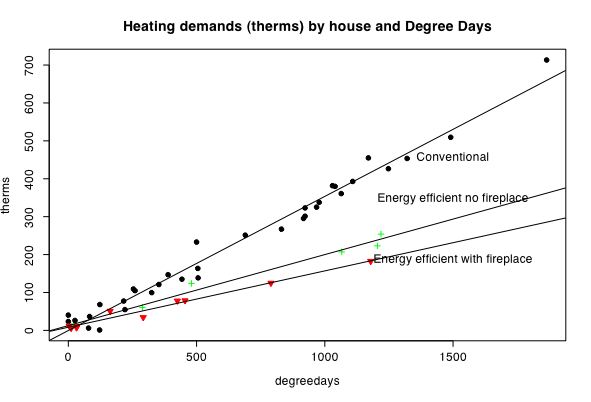
A note for the energy conscious: The conventional house used .35 Therms/degree day while the energy efficient house without a fireplace used .19 therms/degree day. When an energy efficient (high combustion) fireplace was installed, the use dropped to .15 therms/degree day for a 60% reduction in gas consumption compared to the conventional house.
part of a short guide to R
Version of December 31, 2004
William Revelle
Department of Psychology
Northwestern University